
Sharp Wireless Weather Station, part 1
What is the goal?
I have a weather station with a wireless temperature/humidity sensor. Instead of looking at the LCD on the wall, I'd like to have that data on my phone. A graph of historical data would be nice as well.
What am I starting with?
This is a Sharp SPC775, and the FCC has pictures of it.
From the FCC test report, we get operation frequency of "917.19MHz" and modulation of "GFSK". On the last page of that report, you can see the spectrum analyzer output showing two peaks roughly 25kHz apart. These would be the two frequencies to look for.
What does the transmission look like?
I turned to a sdr to start looking at this data. The LED on the probe blinks when it is transmitting, which is useful to confirm which signal is the right one. I found my probe's transmissions centered at 917.187MHz +/- 35kHz, which is a 3kHz/3ppm error. That's a much lower error than I would expect. I used FM decoding mode in my SDR software to hear the two different tones.
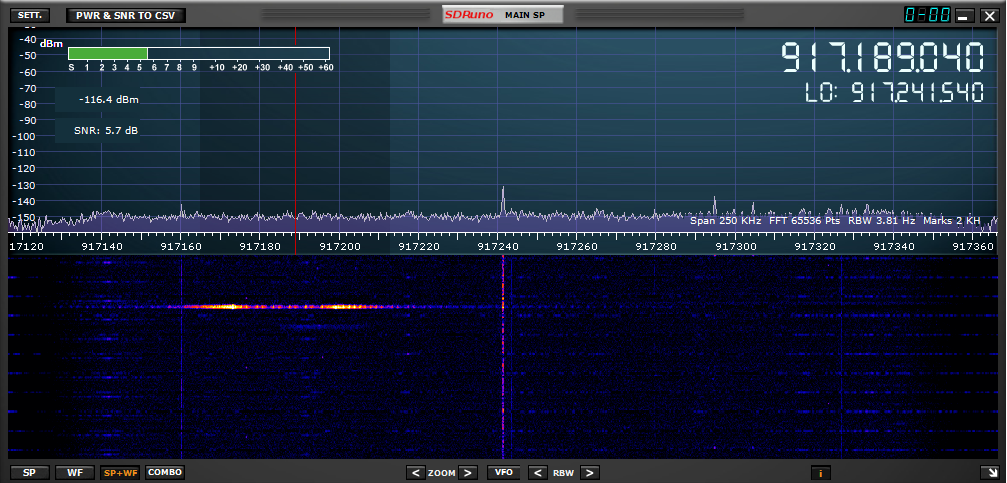
You can see the transmission in the SDR waterfall (bottom half), it's the two bright horizontal yellow lines that fade into purple. The left and right lines represent the two different frequencies this is transmitting on. It's a very short transmission at 0.15 seconds. It repeats every 57 seconds.
What does the transmission sound like?
To look closer at the transmission, I took an audio recording of it from my SDR and imported it into Audacity.
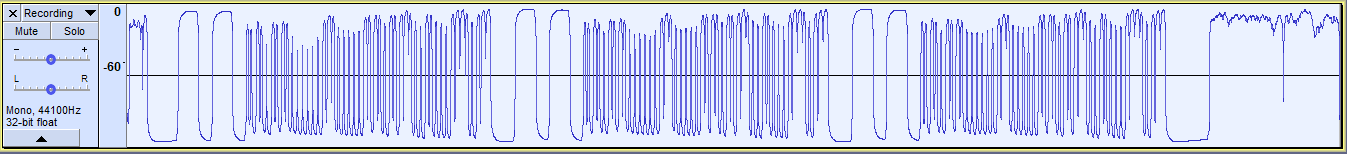
The FM decoding results in this audio recording going low when the frequency is low, and the recording goes high when the frequency goes high. You can see the major features of this transmission - the slow changing parts at the start for synchronization, the faster moving data sections, everything is repeated three times, and it ends by going low. You can hear it below. The audio compression prevents this from being a useful way to see the data sections, but it's good enough for a general idea.
More info
Questions? Comments? Contact information