
Temperature compensation, part 2
In the last part, I measured the TCXO to fit a frequency vs temperature curve.
Frequency vs Temperature curve
Below are the final curves that I went with for the two systems, and a comparison of the median frequency at each temperature point. The rpi system has colder temps because of the previous experiment.
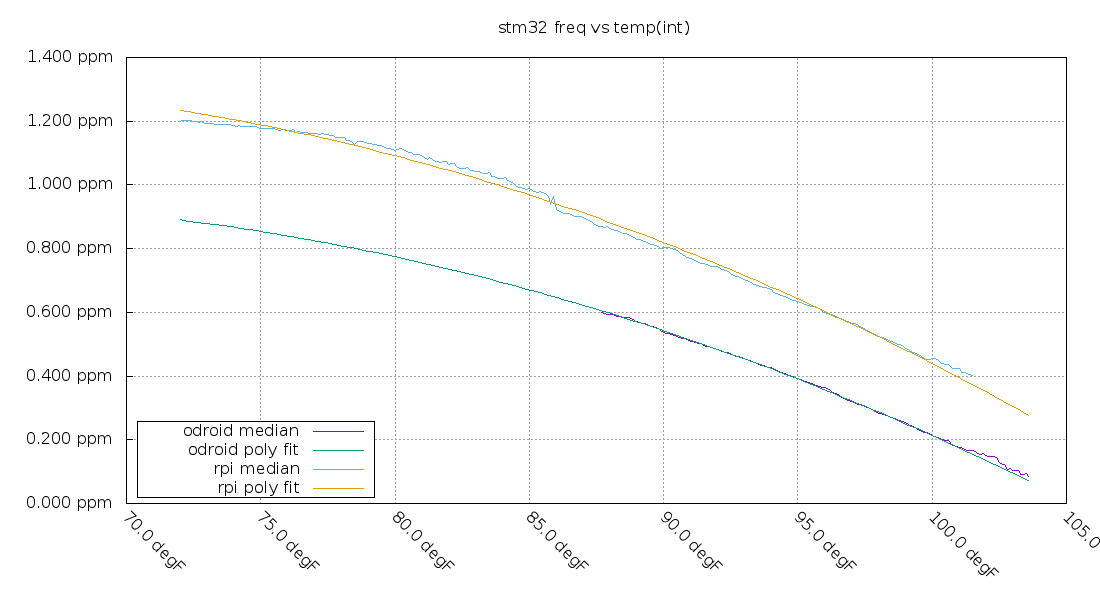
The point of fitting the frequency vs temperature curve is to predict what frequency the TCXO will be in the future. The smaller the error in that prediction, the better.
Data Flow
The data flow looks like this:

Measure: Supply Voltage
The temperature measurement is dependent on the supply voltage measurement because all ADC values are relative to the supply voltage. The supply voltage changes when the temperature changes. Below is a graph showing the relationship between the voltage and temperature.
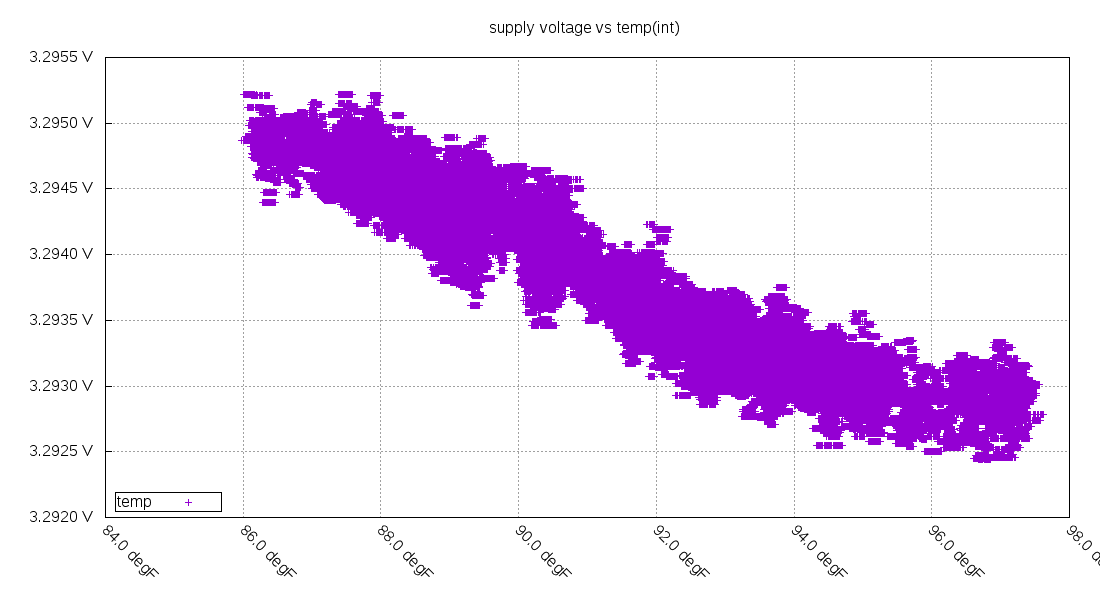
It's only changing 2.5mV over 10F, but that adds a small amount of error (2.5mV=0.6F with this sensor). Measuring the supply voltage via the built-in reference voltage reduces that error.
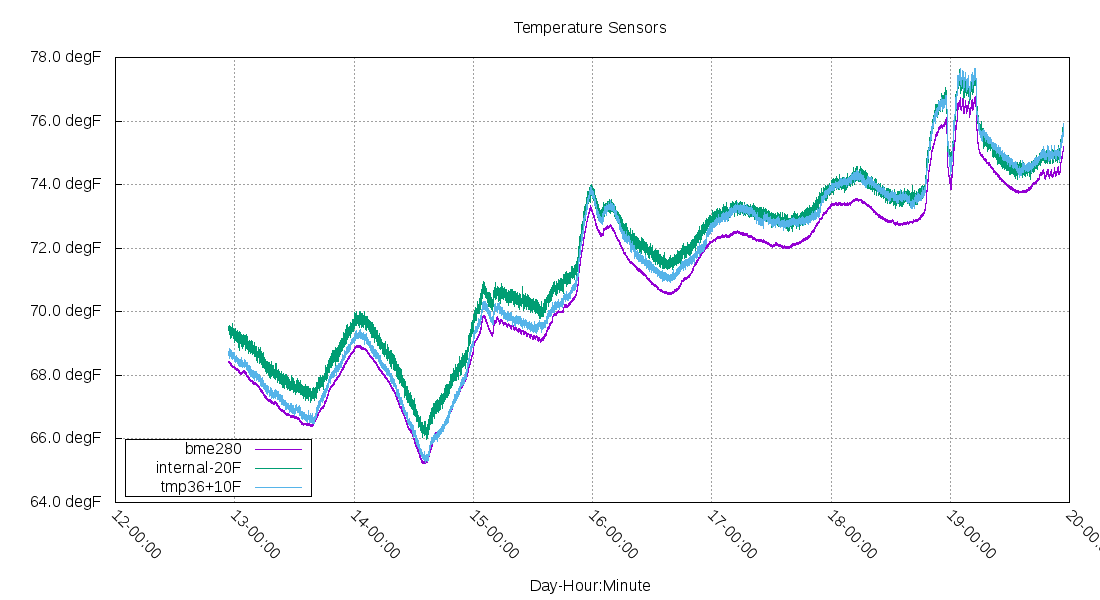
Measure: Temperature
The temperature from three different sensors was recorded. Only the internal sensor was used in the frequency calculations, the other sensors were used as a sanity check.
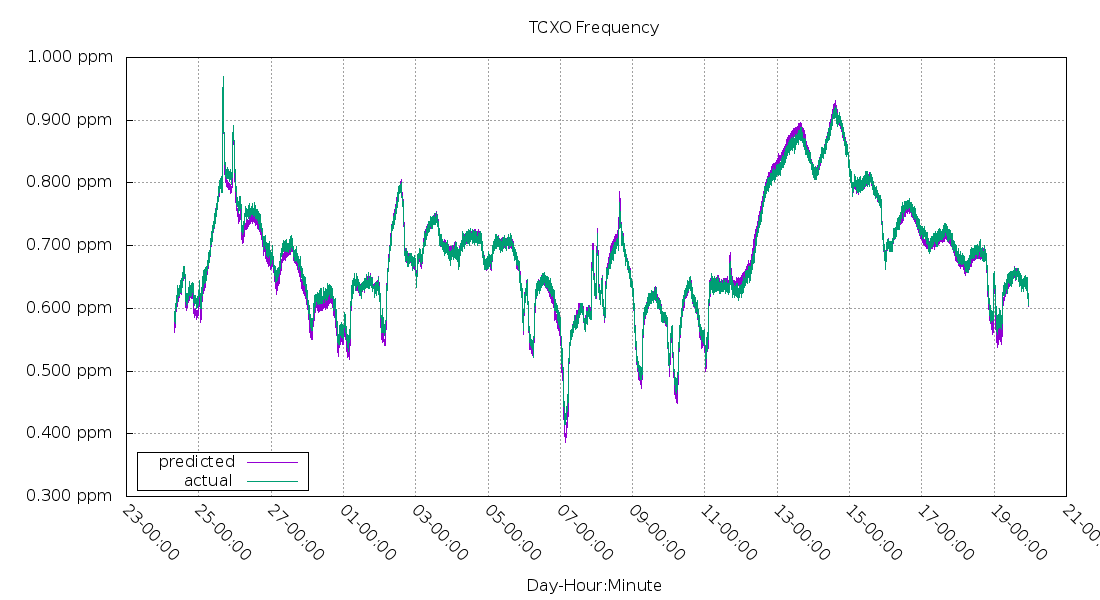
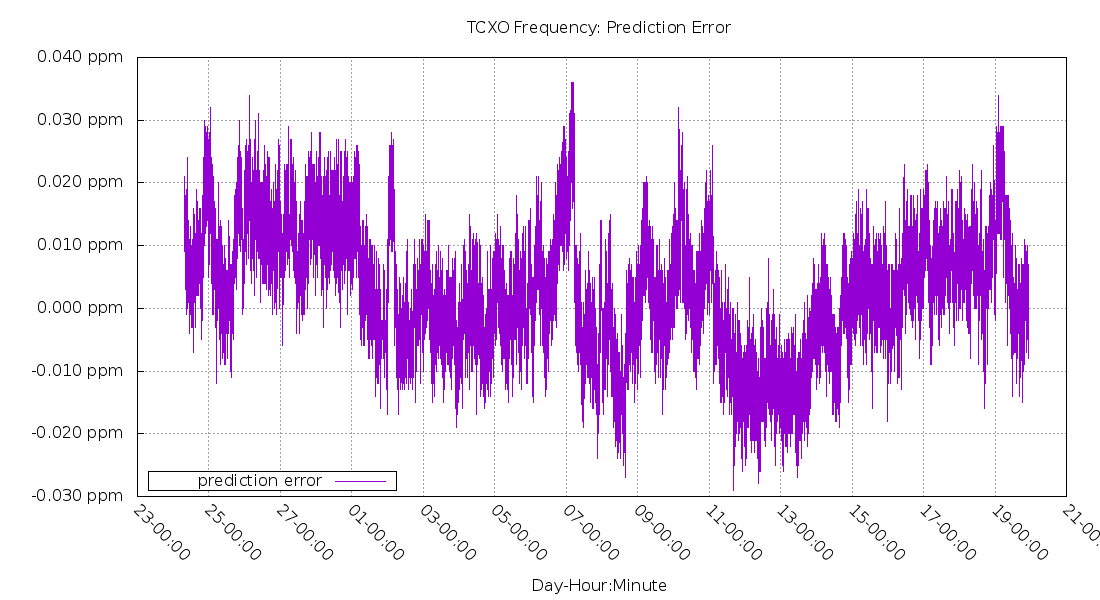
Calculate: TCXO Frequency
Comparing the predicted vs actual value of the TCXO has hard to see lines as they are visually on top of each other.
Here's a graph of just the error (the difference between the prediction and actual).
Measure: Raspberry Pi's Frequency (via PWM)
The next measurement is the frequency of the Raspberry Pi.
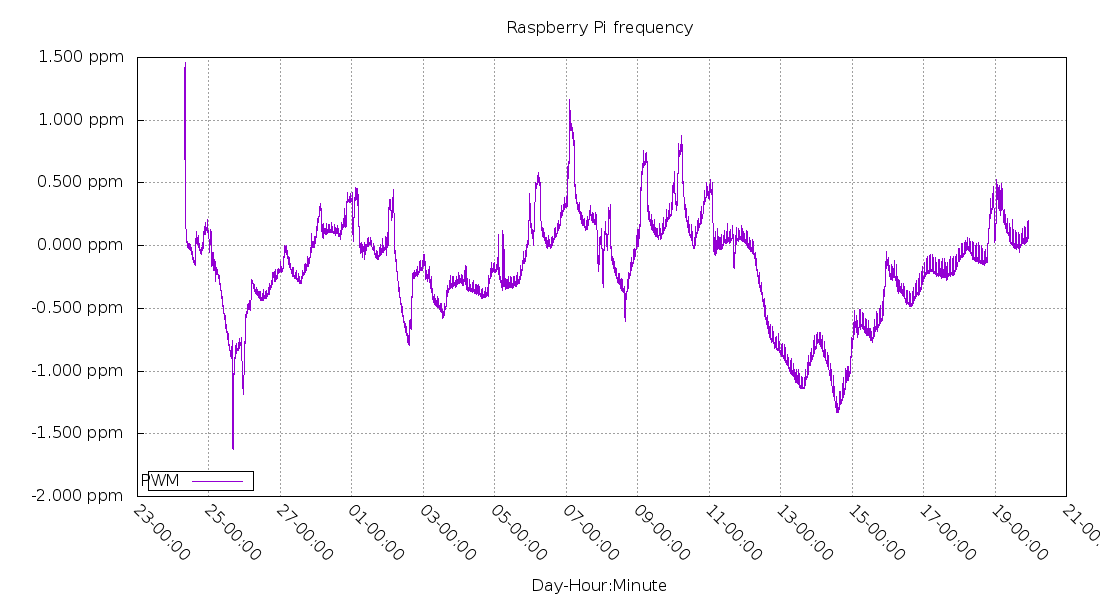
This is the frequency sent to chronyd.
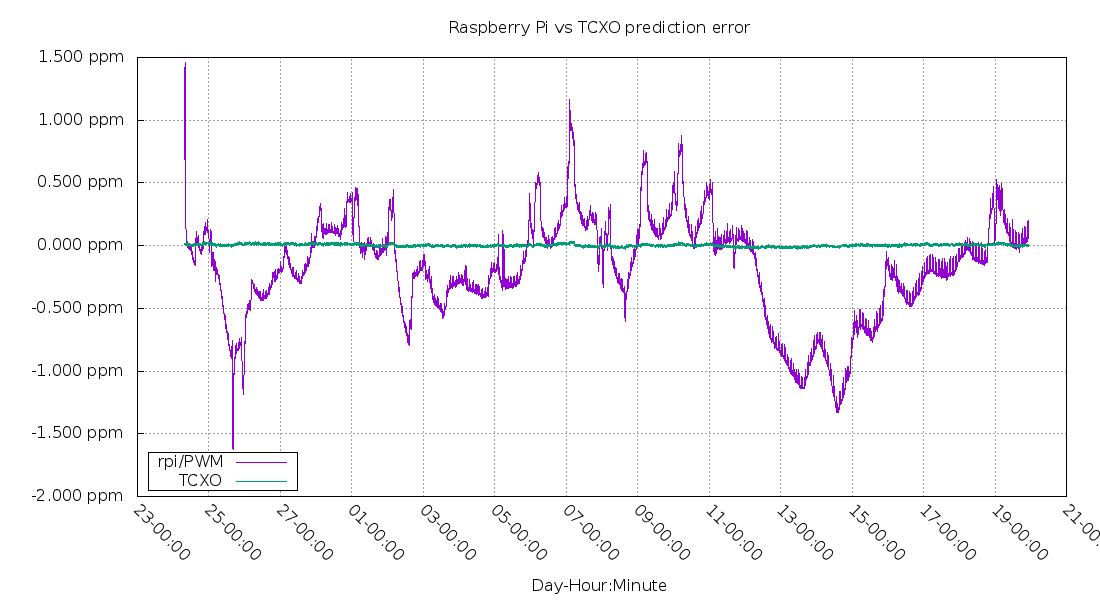
Comparing the Raspberry Pi frequency error vs the TCXO prediction error gives you an idea of the scale difference.
Side note: hourly frequency spikes
The hourly frequency spikes come from the program generating these graphs - the rsync process transfers enough data to run for about 30 seconds, which heats up the CPU.
Zooming in to 4 minutes worth of frequency data during one of those spikes:
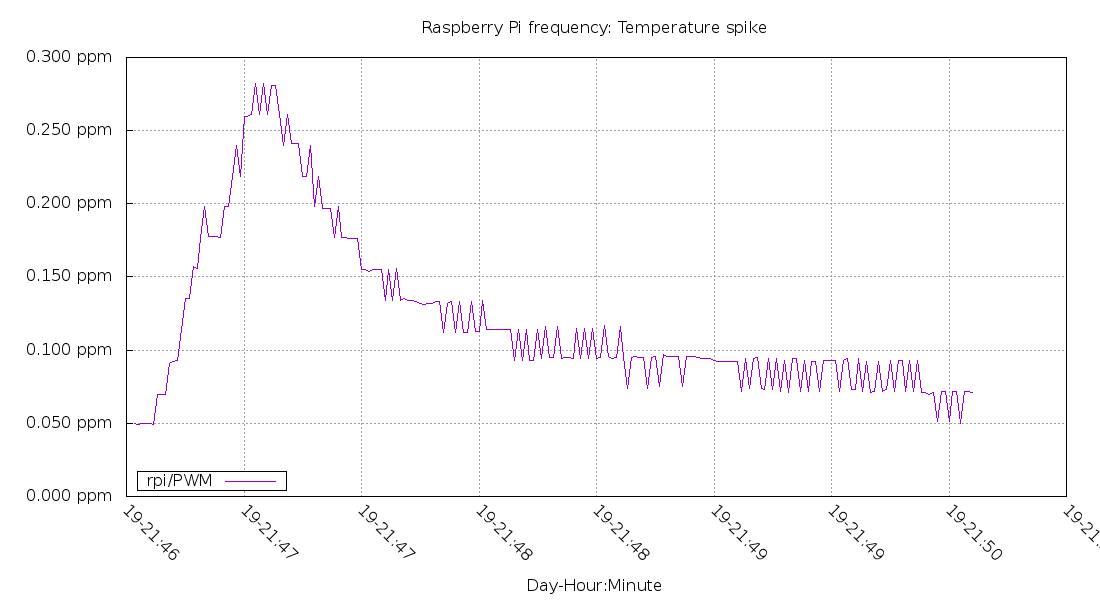
Also, the 20ppb jumps are from the counter running at 48MHz (=20ns precision).
System Frequency Sent to chronyd
After chronyd adjusts for the system frequency error, the remaining frequency error looks like this:
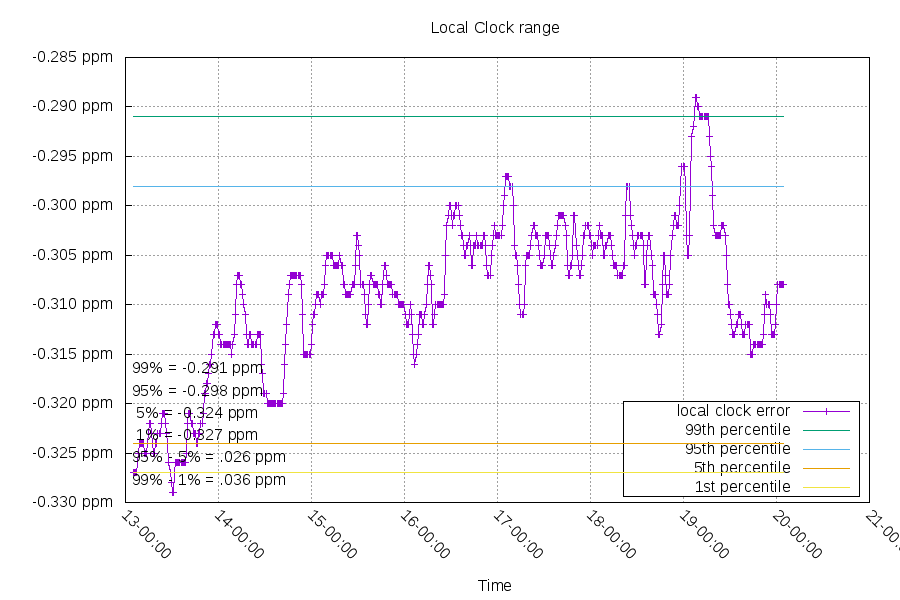
The system is using the GPS PPS as its time source, and is configured with a 1024 second poll. The important scale is 0.036ppm between the 99-percentile and 1-percentile values. That's the long term uncertainty in this clock.
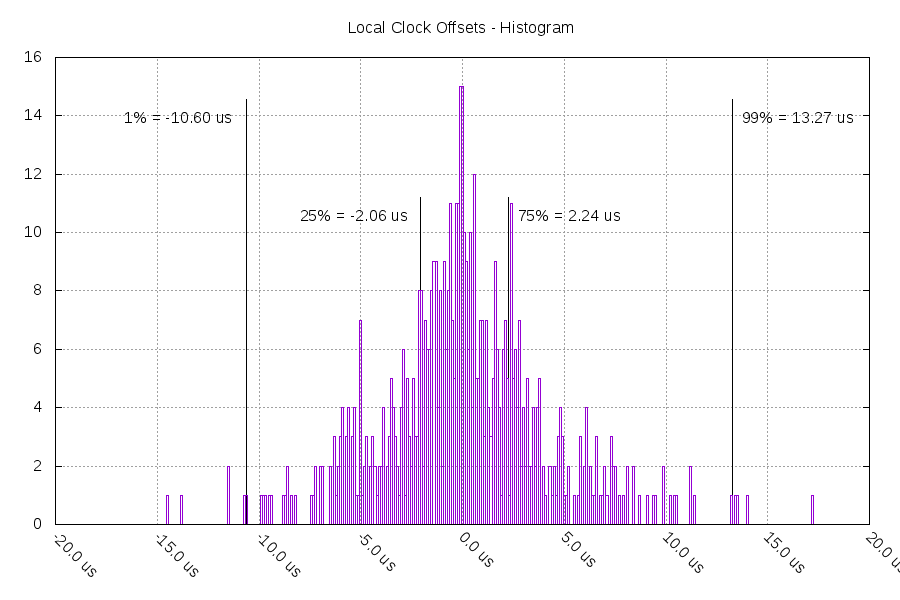
So in 1024 seconds, the clock can wander +/-13.3us. That's 13 ppb. 50% of the time, it was within +/-2.2us, which is 2.1ppb.
The GPS is still having some troubles getting a lock, probably because of its position. I suspect electrical noise on the breadboard is getting into the GPS receiver. Moving the GPS farther away from everything helped a bit.
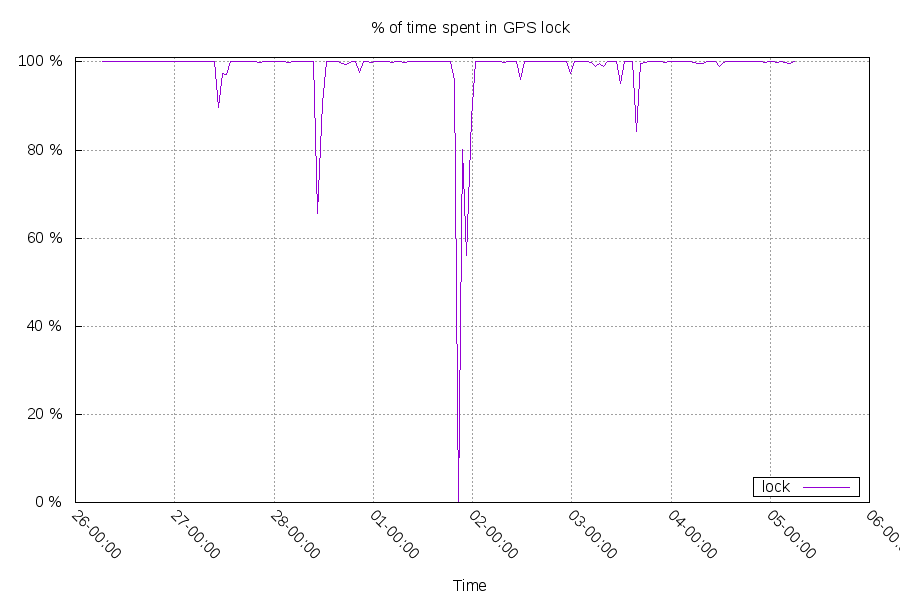
On March 1st, there were some extended times without a satellite lock. It lost lock twice, once for 74 minutes and once for 34 minutes. During the times without GPS clock guidance, the tempcomp-enabled clock drifted 21.342us (4.8ppb) and 10.414us (5.1ppb) in those times.
Summary
The more stable your local frequency, the longer you can go between polling servers, the less network jitter affects your measurements. This can raise the quality of time served from locations that have no way to use a GPS antenna.
Last graph: the adev of the predicted TCXO.
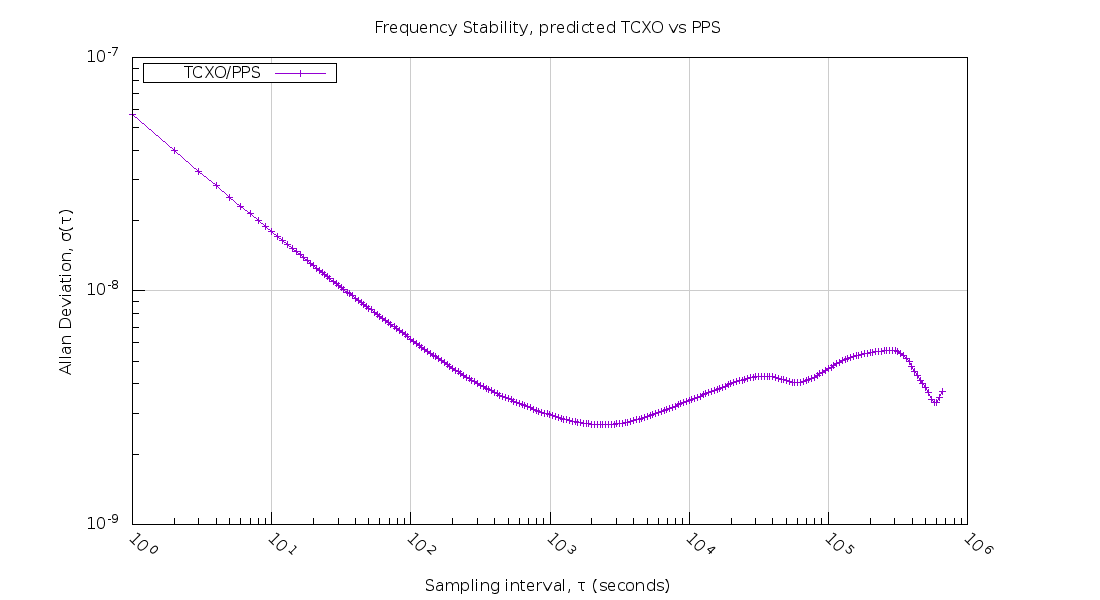
Highlighted points: 5.7e-8 at 1 second, minimum of 2.7e-9 at 41 minutes
Questions? Comments? Contact information