Measuring Asymmetric latency via NTP
Goal
Learn more about the latency characteristics of my cable connection.
Starting point
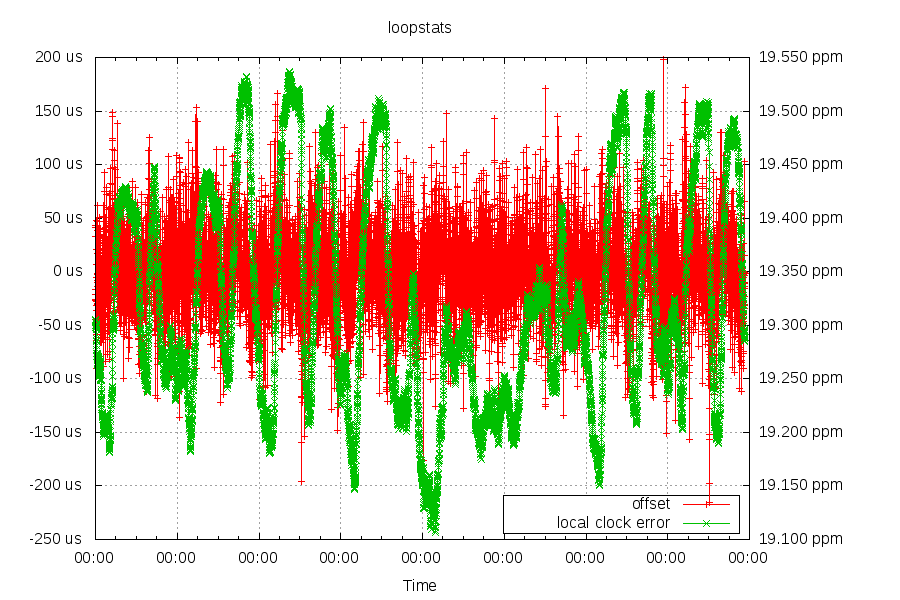
I have a stratum 1 NTP server at home. Below is a graph of its performance.
The offset between the GPS clock and the server's clock is in red. The two clocks are within +/- 50us 90% of the time. The noise comes from transferring timing information over USB.
The green line is the frequency of the server's clock. 90% of the time, the server's clock changes speed at 55 parts per billion (over 10 hours, 2ms slower or faster) or less in 30 minutes. The main reason for the change in speed is temperature. Specifically, the AC system kicking into awake/away/home/sleep modes. Days #5/#6 were the weekend, where the AC system spends more time in "home" mode.

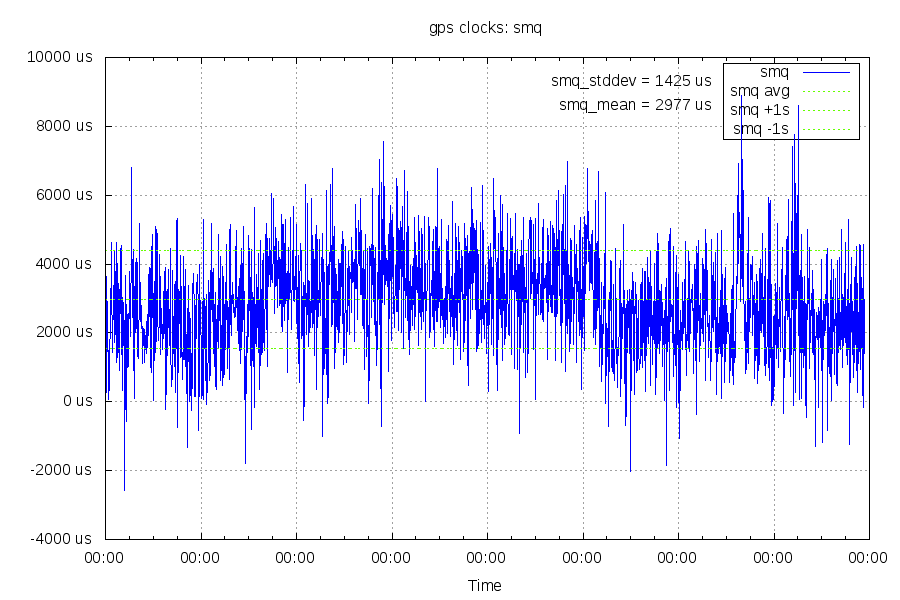
The NTP server also polls a stratum 1 clock over the internet, 64ms away. Below is a graph comparing NTP's calculation of the difference between the clocks of the two systems.

That's not all that great, one standard deviation is +/- 1.4ms between two clocks that should only differ by 50us at the most. This is where internet latency comes into play, as NTP can't tell the difference between asymmetric and jittery latency and clock offsets.
DOCSIS latency
With a DOCSIS cable modem, the downstream direction (internet to modem) is simple as there's only one transmitter. This means in the downstream direction, there's only queueing and transmission time to consider.
Transmission times are also simple. A NTP packet is 90 bytes including the ethernet header. This works out to be 80us/27us in the upstream direction (depending on if it's going over a docsis 1.x or docsis 2.0+ upstream channel) and 19us in the downstream direction.
But in the upstream direction (modem to internet), there's a catch. There can be many transmitters (modems) on the same segment. To manage that, DOCSIS uses a time-division system to allocate upstream bandwidth. The modem signals it has data with a "request", and the CMTS (the other end) allocates a time slice "grant". This can take a millisecond or ten between the modem receiving the packet and finally transmitting it.
Measuring downstream latency
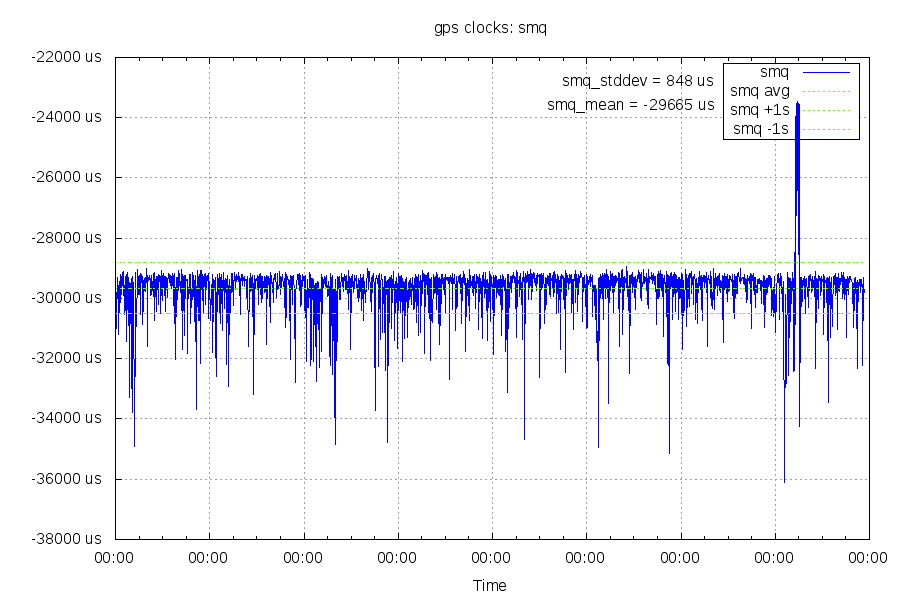
In the graph below, the upstream latency has been removed and only the downstream (internet to modem) latency is showing. Any clock differences are also included, but should be under 50us. See the "math explained" section for where this data comes from. This is showing downstream latency as a negative number because I didn't bother inverting it. The work of multiplying by -1 is left as an excercise for the reader.
The "top" of the points at around 29ms represents a minimal delay of the NTP response. The blip up to 24ms was probably a temporary internet path change. To put the downward spikes in the graph into perspective, a 4ms buffer at 608Mbit/s (16 channel downstream bonding) is 380kb, or 253 full mtu packets. Queueing and NIC interrupt mitigation on other devices in the path would also generate downward spikes like this.

Measuring upstream latency
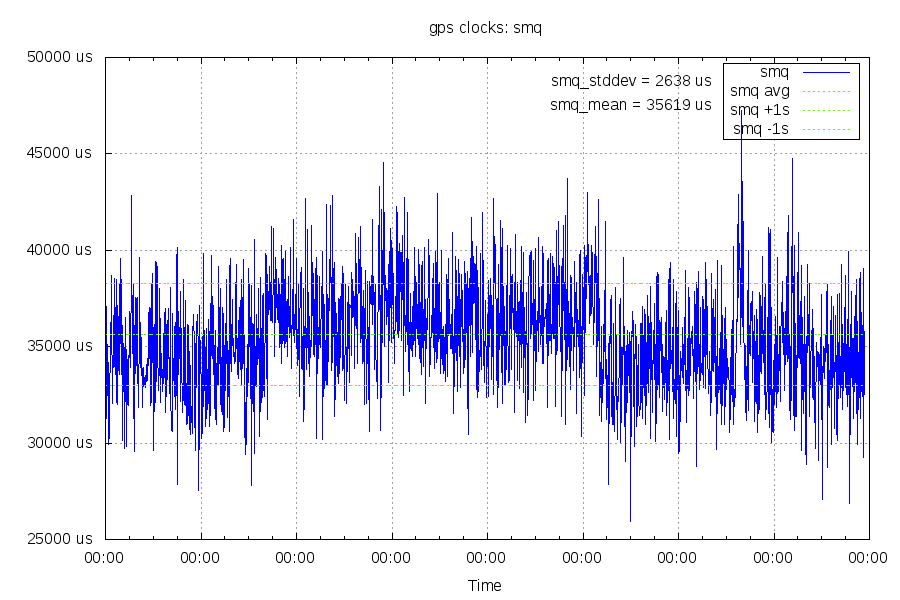
This is measuring the upstream (modem to internet) latency, along with any clock differences. See the "math explained" section on where this data came from.
You can see that the upstream direction is much noisier (2.6ms standard deviation vs 0.8ms). This direction also takes an additional 6ms, some of which is explained by an asymmetric internet path (it takes Cogent on the upstream direction and BTN on the downstream direction).

Math explained
Starting with the NTP offset calculation, the local timestamp of when the request was sent $time_local is subtracted from the remote timestamp $time_remote as well as half the round trip time $rtt.
$offset = $time_remote - $rtt/2 - $time_local
The round trip time $rtt is the time the NTP request takes to go the remote server and back.
$rtt = $request_latency + $response_latency
The remote remote timestamp $time_remote is the local time $time_local plus the time it took to arrive $request_latency plus any difference in the two clocks $true_offset.
$time_remote = $time_local + $request_latency + $true_offset
This means that when the latencies are symmetric (or close enough), $offset is accurate. When latencies are asymmetric, $offset is wrong.
Let's plug in $time_remote to the original $offset equation and simplify.
$offset = $time_local + $request_latency + $true_offset - $rtt/2 - $time_local

$offset = $request_latency + $true_offset - $rtt/2

$offset = $request_latency + $true_offset - ($request_latency + $response_latency)/2
If we want to cancel out the upstream latency, we subtract $rtt/2 from $offset:
$y = $offset - $rtt/2

$y = $request_latency + $true_offset - ($request_latency + $response_latency)/2 - ($request_latency + $response_latency)/2

$y = $request_latency + $true_offset - $request_latency - $response_latency

$y = $true_offset - $response_latency
If we want to cancel out the downstream latency, we add $rtt/2 to $offset
$y = $offset + $rtt/2

$y = $request_latency + $true_offset - ($request_latency + $response_latency)/2 + ($request_latency + $response_latency)/2

$y = $true_offset + $request_latency
If $true_offset is near zero, the graph will just be the request or response latency.
See Also
Part 2, a third party observer
Questions? Comments? Contact information
